The DataClass module
Introduction
In previous activities we've learned how to use Python to simulate physical systems and to fit datasets to physical models. Rather than hosting another activity, this page will host and describe a generic two-dimensional data fitting module that can be used to produce quality fits and plots to a wide range of datasets and models.
Download the data file(s)
There are several example data files. You should download at least one of them. Once your script is working, it should be simple to switch out one data file for another. Along with each data file, there is a corresponding fitting_function that needs to be coded up in your Python script.
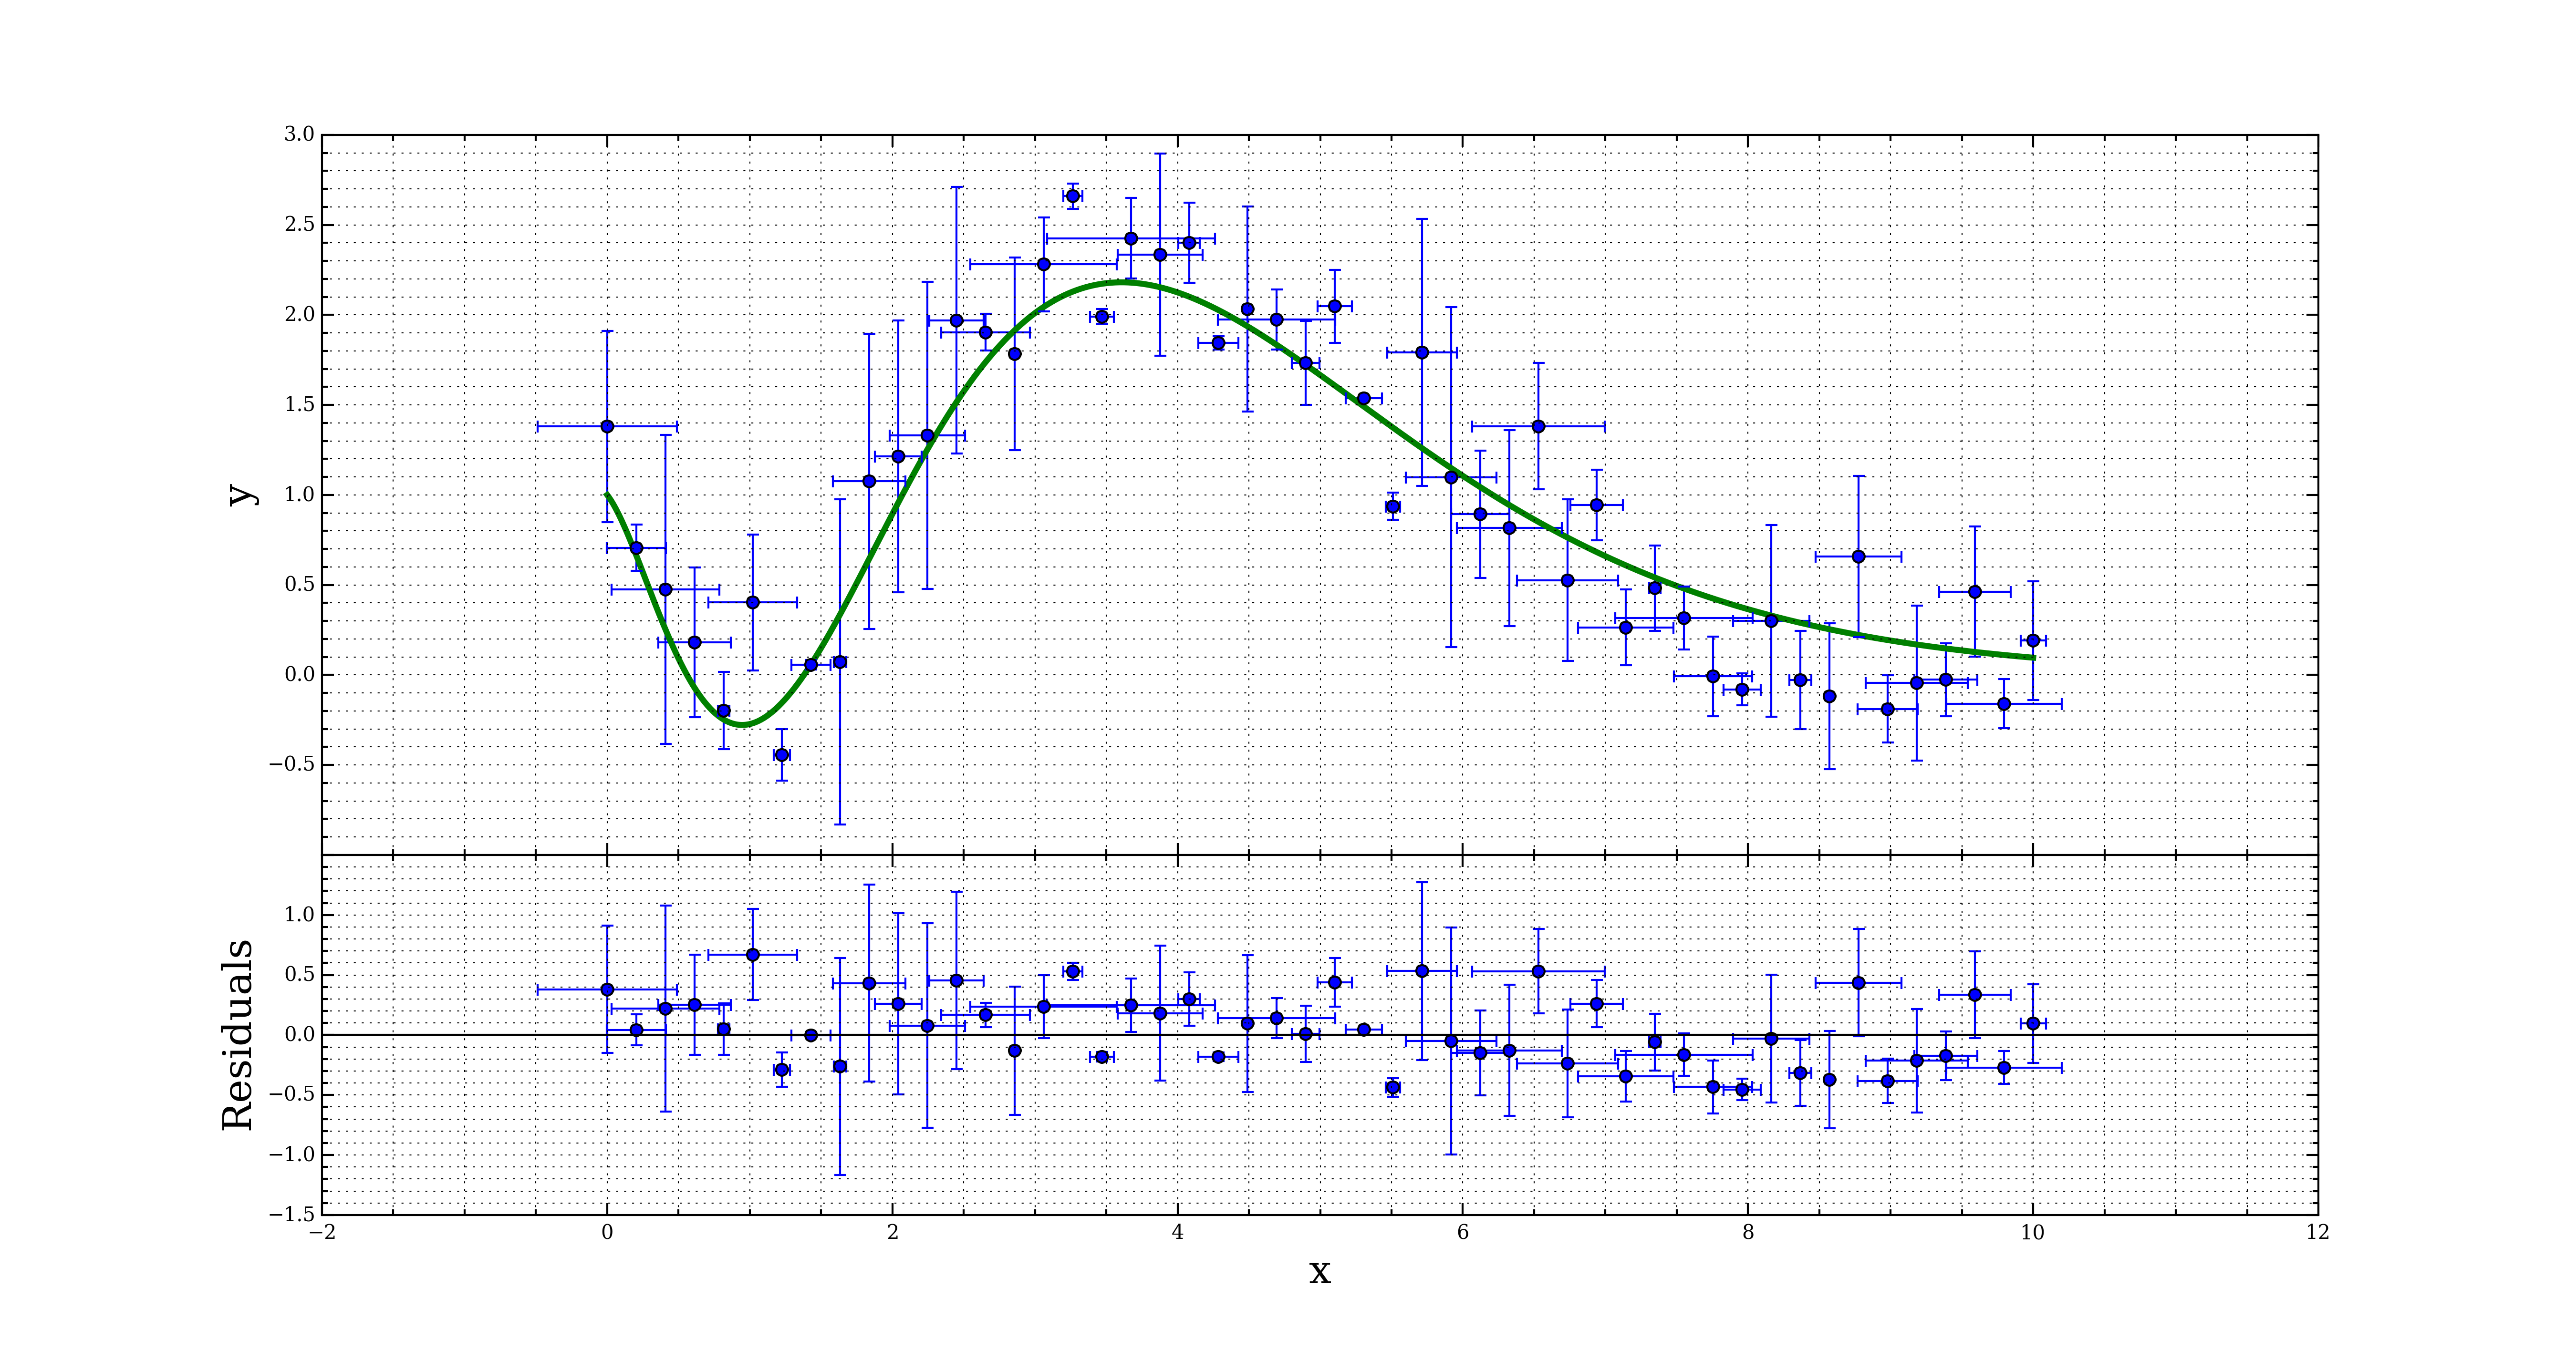
Data 1 -- \( y = \exp(-x/a) \left[ 1 - (x/b)^2 + (x/c)^3 \right] \)
Data 2 -- \( y = x^2 \sin(b x + c) + d \)
Data 3 -- \( y = a \sin(b x + c) + d \)
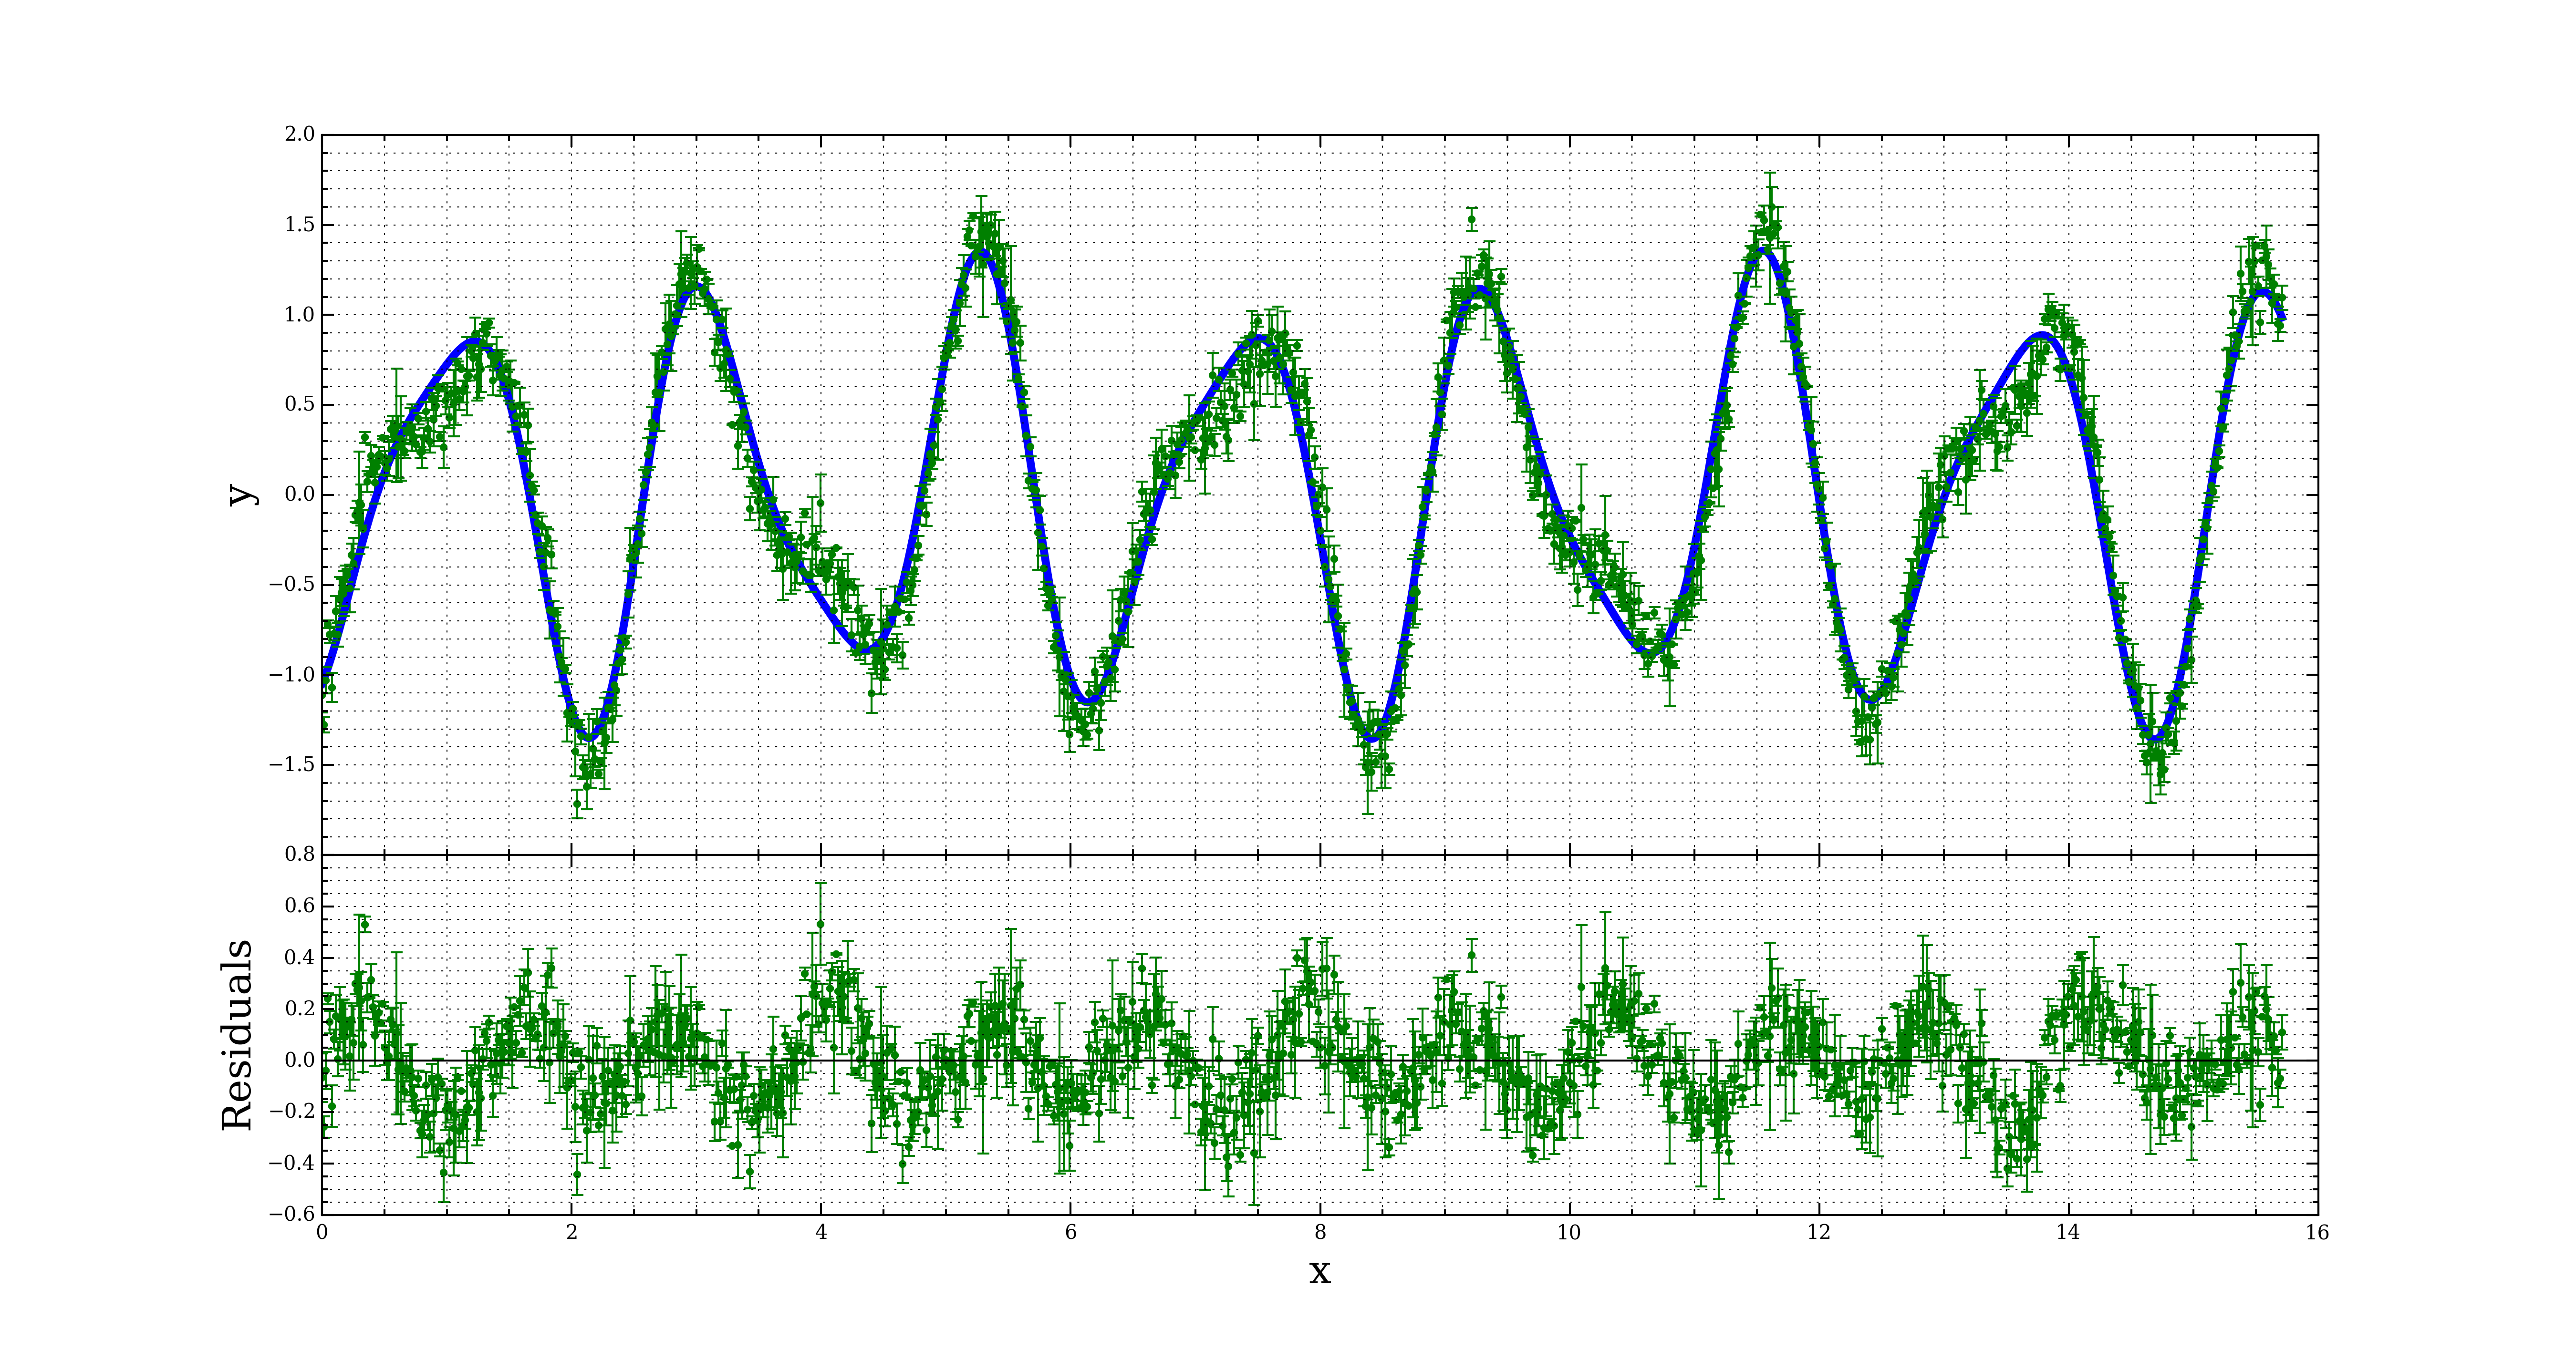
Data 4 -- \( y = a \sin(b x) + c \cos(d x) \)
Make sure to download at least one of these files and save it to the same folder you saved the DataClass.py file.
Exploring DataClass
After you've downloaded the DataClass file, open up a new, blank, Python file. This will be your script with which you load in and fit the data. Before you start coding, change the "Working Directory" in Canopy to the folder where you saved the DataClass.py file. Once you've changed your working directory, complete the following steps to finish your program:
- Import the DataClass module and the Numpy library using an import statement. For example,
import DataClass

import numpy as np - Import any other libraries you might need.
- Next define a function that will be your fitting function. You can name it whatever you like. An example of a fitting function is,
This is a general quadratic equation with three parameters. Your fitting function will depend on which data file you downloaded.def func(x,a,b,c):
return a*x*x + b*x + c - Set a variable data equal to an instance of the Data class. You must pass the file name of the data file as an argument to Data(). For example,
data = DataClass.Data(filename,func) On the next line call the statistics method of data. This will print out some simple statistics such as mean and range of the data.
Finally, call the fit_data method of data. This will fit the data to your fitting function and plot the results. Check the definition of fit_data in the DataClass.py file to check for any arguments it might take.
In the lines below your fitting function definition will be the commands to instantiate a Data object that holds your data.
Now you can execute the script. If all goes well you should see a plot pop up displaying the data and the fit to the data. An example of what you should see is,
Playing with options
Now that you have a working data fitter, try passing different keyword arguments to data.fit_data() to change properties of the plot. Some examples of what you can change are:
- fontsize. This controls the size of the font used in the labels.
- fmt. This controls the shape and color of the points used in plotting the data. It defaults to blue circles.
- markersize. This controls size of the data points.
- color. This sets the color of the best fit line.
- linestyle. This sets the style of the best fit line. It can be solid, '-'; dashed, '--'; or dashed-dot,'-.'.
- linewidth. This controls how thick the best fit line is.
- grid_off. If set to True, this turns of the grid in the plots.
- There are many other style choices that can be found in the documentation for the plot function.